
Adverse Event Rate Calculator
Calculate Exposure-Adjusted Risk
Enter patient counts and exposure times to calculate both simple incidence rate (IR) and exposure-adjusted incidence rate (EIR)
Results
Exposure-Adjusted (EIR) = Events / Total Patient-Years
Incidence Rate (IR)
IR = Events / Total Patients
Measures event occurrence per patient
Exposure-Adjusted (EIR)
EIR = Events / Total Patient-Years
Measures risk per unit time
Key Differences
May mislead when exposure times differ between groups
Essential for comparing trials with varying treatment lengths
When you hear that a drug causes headaches in 15% of patients, it sounds simple. But what if one group took the drug for 3 months and another took it for 2 years? That 15% doesn’t tell the whole story. The real question isn’t just how many people had an adverse event-it’s how long they were exposed to the drug. This is where percentages alone fail, and why regulators like the FDA now demand more precise ways to measure risk.
Why Simple Percentages Mislead
The most common way to report adverse events is the Incidence Rate (IR): just divide the number of people who had an event by the total number of people in the study. If 15 out of 100 patients got a rash, you say 15%. Easy. But this method ignores time. In a trial where one group took the drug for 6 months and another for 24 months, the longer-exposed group will naturally have more events-not because the drug is more dangerous, but because people were exposed longer. A 2010 analysis by Andrade found that using simple percentages in trials with uneven exposure times could underestimate true event rates by 18% to 37%. Imagine a drug that causes liver injury in 2% of patients over 6 months. If you give it to someone for 5 years, the risk isn’t still 2%. It’s much higher. But without adjusting for time, you’d miss that entirely.Enter Patient-Years: The EIR Method
To fix this, statisticians use Event Incidence Rate Adjusted by Patient-Years (EIR). Instead of counting people, you count time. One patient taking a drug for 1 year = 1 patient-year. Ten patients taking it for 6 months each = 5 patient-years. Then you divide the number of events by total patient-years. For example: 12 liver injuries occurred across 1,200 patient-years of exposure. That’s 12 ÷ 1,200 = 0.01, or 1 event per 100 patient-years. This tells you: for every 100 people taking the drug for a full year, you’d expect 1 liver injury. Now you can compare groups with different treatment lengths fairly. Tools like JMP Clinical automate this using start and end dates of treatment (TRTSDTM and TRTEDTM). But even here, problems arise. If a patient stops the drug for 3 weeks due to side effects, should that time count? Most systems don’t automatically exclude it. That’s why 31% of initial analyses have errors in exposure time calculation, according to PharmaSUG forums.The FDA’s Push for EAIR
EIR helps, but it still has a flaw: it counts events, not people. If one patient has five separate episodes of nausea, EIR treats that as five events. But for a doctor deciding whether to prescribe, knowing that five episodes happened to one person is different from five different people each having one episode. That’s where Exposure-Adjusted Incidence Rate (EAIR) comes in. EAIR adjusts for both time and recurrence. It answers: how many people had at least one event, and how long were they exposed? It’s more complex, but more clinically meaningful. In 2023, the FDA requested EAIR in a supplemental biologics license application (sBLA) for the first time. It wasn’t a suggestion-it was a requirement. This signaled a major shift. The agency no longer accepts simple percentages as sufficient for safety evaluation, especially in long-term studies.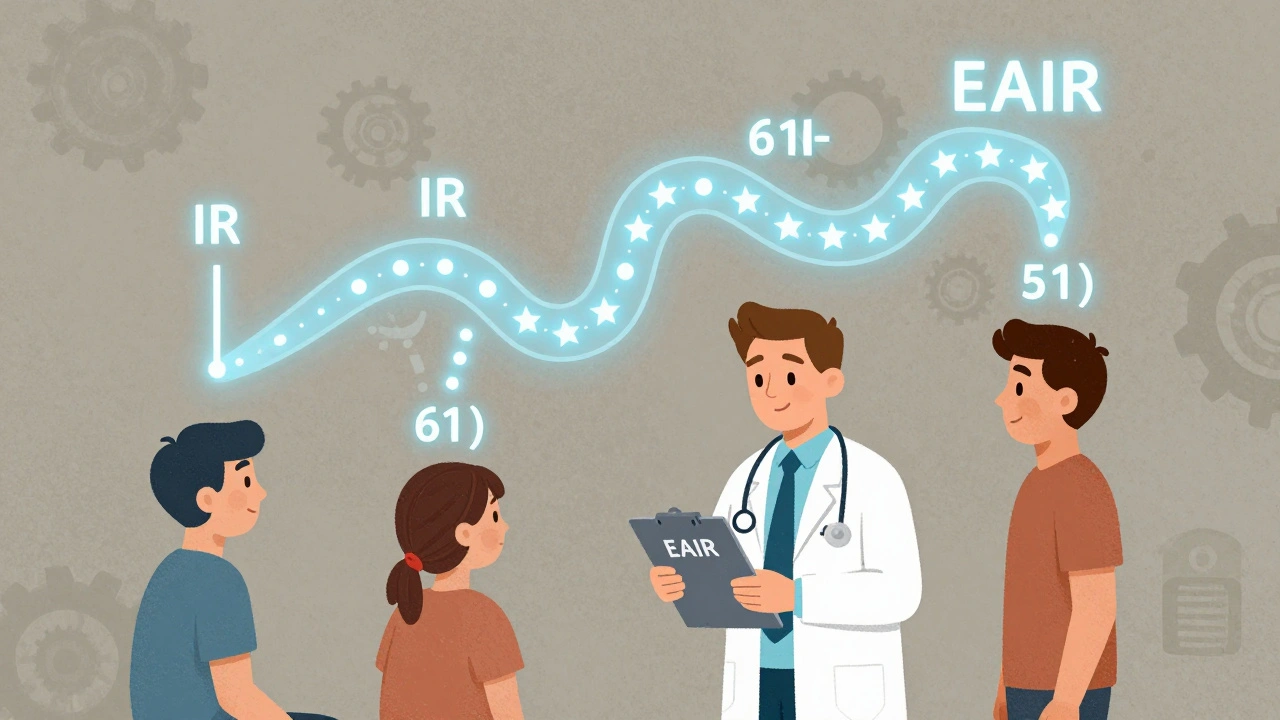
Relative Risk and Confidence Intervals
Comparing two drugs? You don’t just look at their individual rates-you calculate the ratio. That’s the Incidence Rate Ratio (IRR): divide the rate in Group A by the rate in Group B. If Group A has 2.5 events per 100 patient-years and Group B has 1.0, the IRR is 2.5. That means Group A has 2.5 times the rate of events. But numbers alone aren’t enough. You need to know if that difference is real or just random noise. That’s where confidence intervals come in. For incidence rates, the Wilson score method with continuity correction is the gold standard. For IRR, the Wald method is used. In R, statisticians useprop.test() for rates and riskratio() for ratios.
If the 95% confidence interval for an IRR includes 1.0, the difference isn’t statistically significant. If it’s 1.8 to 3.2, then yes-there’s a real difference.
Competing Risks and Why Kaplan-Meier Fails
Not all patients stay in the study. Some die. Some quit. Some switch drugs. This creates what statisticians call “competing risks.” If a patient dies before having a heart attack, you never get to observe the heart attack. But if you use the Kaplan-Meier estimator (common in survival analysis), you treat death as a “censored” event, which distorts the risk of the event you’re studying. A 2025 study in Frontiers in Applied Mathematics and Statistics showed that using Kaplan-Meier in these cases leads to misleading results. Instead, they recommend cumulative hazard ratio estimation, which separates the risk of death from the risk of the adverse event. This gives a clearer picture: is the drug increasing heart attack risk, or are people just dying faster from other causes?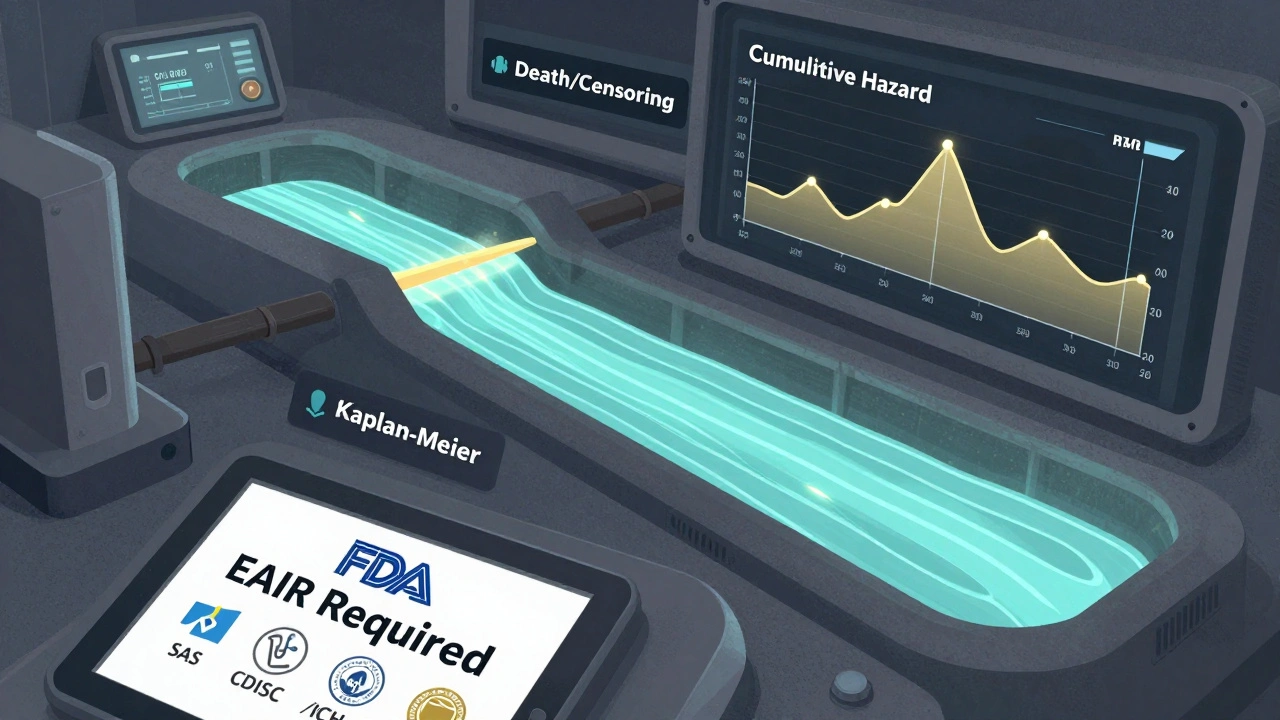
Real-World Impact: What Happens When You Get It Right
MSD’s safety team found that switching to EAIR uncovered previously missed safety signals in 12% of their chronic therapy programs. One drug looked safe in traditional reports-until they realized patients on the placebo arm dropped out early due to side effects, making the comparison unfair. EAIR corrected that. But adoption isn’t easy. A 2024 PhUSE survey found that writing EAIR code in SAS takes 3.2 times longer than IR. It requires deeper programming skills and more data cleaning. And even when done right, medical reviewers often don’t understand it. Roche reported that 35% of reviewers initially misinterpreted EAIR results, leading to unnecessary delays. That’s why PhUSE released standardized SAS macros in March 2023. They’ve been downloaded over 1,800 times. Teams using them report an 83% drop in programming errors.What You Need to Know Now
The FDA, EMA, and ICH are all moving toward exposure-adjusted methods. ICH E9(R1), effective since 2020, requires that safety analyses account for treatment discontinuation and exposure time. CDISC’s 2023 Oncology guide now mandates both IR and EAIR for serious adverse events. If you’re reviewing a clinical trial report:- Check if they used IR, EIR, or EAIR.
- Look for the denominator: number of patients, or patient-years?
- See if they adjusted for treatment interruptions.
- Ask: does the method match the clinical question?
The Future Is Exposure-Adjusted
The global clinical trial safety software market hit $1.84 billion in 2023, growing 22.7% year-over-year. Why? Because regulators are demanding better data. By 2027, experts predict 92% of Phase 3 submissions will include EAIR. The FDA’s 2024 draft guidance on exposure-adjusted analysis is now open for public comment. The Sentinel Initiative is training AI to detect safety signals using EAIR-early tests show 38% better detection than old methods. This isn’t just statistics. It’s about patient safety. Getting the numbers right means doctors can make better decisions. Patients get the right treatment, with the right level of risk understood.Forget the simple 15%. The future of drug safety is measured in time, recurrence, and context.
What’s the difference between incidence rate (IR) and exposure-adjusted incidence rate (EAIR)?
IR is the percentage of patients who had an adverse event, regardless of how long they were on the drug. EAIR adjusts for both the number of patients and the total time they were exposed, accounting for how long each person was at risk. EAIR gives a more accurate picture of risk over time, especially when treatment durations vary between groups.
Why does the FDA now prefer EAIR over simple percentages?
Simple percentages can hide real safety issues when patients are exposed to a drug for different lengths of time. In long-term studies, EAIR reveals patterns that IR misses-like increased risk in patients who stay on treatment longer. The FDA requested EAIR in a 2023 regulatory submission, signaling it’s now a required standard for accurate safety reporting.
Can you use Kaplan-Meier to analyze adverse events in clinical trials?
No, not reliably. Kaplan-Meier treats events like death or treatment discontinuation as "censored," which distorts the true risk of the adverse event you’re studying. In trials where patients die or drop out before experiencing the event, this method overestimates the risk. Experts now recommend cumulative hazard ratio estimation instead, which separates competing risks like death from the event of interest.
How do you calculate patient-years in a clinical trial?
For each patient, subtract the date they started the drug from the date they stopped (or the study ended), then divide by 365.25 to convert days to years. Add up all those years across all patients. That’s your total patient-years. Tools like JMP Clinical automate this using start (TRTSDTM) and end (TRTEDTM) dates from trial data.
What’s the role of CDISC and ICH in adverse event reporting?
CDISC sets data standards for clinical trials, and its 2023 Oncology guide now requires both IR and EAIR for serious adverse events. ICH E9(R1), implemented in 2020, requires that safety analyses account for treatment discontinuation and exposure time. Together, they’re pushing the industry toward standardized, time-adjusted methods to ensure consistent, reliable safety data across global trials.


Louis Llaine, December 7, 2025
So let me get this straight-we’re now counting patient-years like it’s a damn spreadsheet game? Next they’ll charge us by the hour for side effects. 🤡
Jane Quitain, December 8, 2025
OMG this is so important!! I just read this and my brain lit up like a Christmas tree 🎄✨ Finally someone gets it-time matters! I’ve seen so many studies where they just say ‘15% had headaches’ and I’m like… but for how long?? 😭 Thank you for explaining EAIR so clearly!!
Ernie Blevins, December 10, 2025
This whole EAIR thing is just corporate jargon to make bad drugs look safer. They’re just hiding the real numbers behind fancy math. 12% of safety signals missed? Yeah right. More like 80%.
Kurt Russell, December 10, 2025
Y’ALL. THIS IS THE MOST IMPORTANT THING I’VE READ ALL YEAR. 🚨 The FDA finally getting it? EAIR isn’t just stats-it’s saving lives. Imagine a mom choosing a drug for her kid, and the report says ‘2% risk’… but that’s over 6 months. What if she’s on it for 5 years? That’s not 2%. That’s like 15%. And nobody told her. This isn’t academic. This is ethics. Thank you for writing this. 🙏
Stacy here, December 10, 2025
Wait… so you’re telling me Big Pharma has been lying to us for decades by using simple percentages? And now the FDA is ‘requiring’ EAIR like it’s some revolutionary new idea? 🤔 I call BS. This isn’t progress-it’s damage control. They knew this was flawed. They just didn’t care until someone sued them. The Sentinel Initiative? AI? Please. It’s all smoke and mirrors. The real question: who owns the algorithm? And why does it take 3.2x longer to code EAIR in SAS? Coincidence? I think not.
Wesley Phillips, December 11, 2025
IR is for toddlers. EAIR is for adults who can handle math and don’t want to get sued. The fact that 35% of reviewers misinterpret EAIR just proves we need better training-not less math. Also, Kaplan-Meier is dead. RIP. Long live cumulative hazard ratios.
Olivia Hand, December 12, 2025
So if a patient has 5 nausea episodes over 18 months, EAIR counts them as one person with recurrence, not five events? That’s actually brilliant. It shifts the focus from ‘how many times did it happen’ to ‘how many people were affected’-which is what doctors actually care about. Why didn’t we do this sooner?
Desmond Khoo, December 13, 2025
YES YES YES 😭 this is the kind of stuff that actually matters. I work in pharma and I’ve seen teams spend weeks arguing over IR numbers while the real risk was hiding in plain sight. EAIR is the future. And yes, SAS is a nightmare-but the PhUSE macros? Game changer. 🙌 83% fewer errors? That’s not a stat-that’s a revolution. Thank you for making this feel human.
Kyle Oksten, December 15, 2025
There’s a quiet dignity in measuring risk by time, not just by headcount. It acknowledges that each patient’s journey is unique-not a statistic, but a life lived in days, weeks, months. EAIR doesn’t just adjust the numbers-it adjusts our respect for the people behind them.